Visualise methylation colour scalebar
Source:R/visualise_methylation.R
visualise_methylation_colour_scale.Rdvisualize_methylation_color_scale() is an alias for visualise_methylation_colour_scale() - see aliases.
This function creates a scalebar showing the colouring scheme based on methylation
probability that is used in visualise_methylation(). Showing this is particularly
important when the colour range is clamped via low_clamp and high_clamp (e.g.
setting that all values below 100 are fully blue (#0000FF), all values above 200 are
fully red (#FF0000), and colour interpolation occurs only in the range 100-200, rather
than across the whole range 0-255). If clamping is off (default), then 0 is fully blue,
255 is fully read, and all values are linearly interpolated. NB: colours are configurable
but default to blue = low modification probability and red = high modification probability.
Usage
visualise_methylation_colour_scale(
  low_colour = "blue",
  high_colour = "red",
  low_clamp = 0,
  high_clamp = 255,
  ...,
  full_range = c(0, 255),
  precision = 10^3,
  background_colour = "white",
  axis_location = "bottom",
  axis_title = NULL,
  do_axis_ticks = TRUE,
  outline_colour = "black",
  outline_linewidth = 1,
  monitor_performance = FALSE
)
Arguments
- low_colour
character. The colour that should be used to represent minimum probability of methylation/modification (defaults to blue).- high_colour
character. The colour that should be used to represent maximum probability of methylation/modification (defaults to red).- low_clamp
numeric. The minimum probability below which all values are colouredlow_colour. Defaults to0(i.e. no clamping). To specify a proportion probability in 8-bit form, multiply by 255 e.g. to low-clamp at 30% probability, set this to0.3*255.- high_clamp
numeric. The maximum probability above which all values are colouredhigh_colour. Defaults to255(i.e. no clamping, assuming Nanopore > SAM style modification calling where probabilities are 8-bit integers from 0 to 255).- ...
Used to recognise aliases e.g. American spellings or common misspellings - see aliases. If any American spellings do not work, please make a bug report at https://github.com/ejade42/ggDNAvis/issues.
- full_range
numeric vector, length 2. The total range of possible probabilities. Defaults toc(0, 255), which is appropriate for Nanopore > SAM style modification calling where probabilities are 8-bit integers from 0 to 255.
May need to be set toc(0, 1)if probabilites are instead stored as decimals. Setting any other value is advanced use and should be done for a good reason.- precision
integer. How many different shades should be rendered. Larger values give a smoother gradient. Defaults to10^3i.e.1000, which looks smooth to my eyes and isn't too intensive to calculate.- background_colour
character. The colour the background should be drawn (defaults to white).- axis_location
character. Which edge should be labelled. The gradient will always be along this axis (i.e. horizontal gradient for"top"or"bottom", vertical gradient for"left"or"right"). Accepts"top"/"north","bottom"/"south","left"/"west", and"right"/"east"(not case sensitive).- axis_title
character. The desired axis title for the edge selected byaxis_location. Defaults toNULL.- do_axis_ticks
logical. Boolean specifying whether gradient axis ticks should be enabled (TRUE, default) or disabled (FALSE).- outline_colour
character. The colour of the scalebar outline. Defaults to black.- outline_linewidth
numeric. The linewidth of the scalebar outline. Defaults to1. Set to0to disable scalebar outline.- monitor_performance
logical. Boolean specifying whether verbose performance monitoring should be messaged to console. Defaults toFALSE.
Value
ggplot of the scalebar.
Unlike the other visualise_<> functions in this package, does not directly export a png. This is because there are no squares that need to be rendered at a precise aspect ratio in this function. It can just be saved normally with ggplot2::ggsave() with any sensible combination of height and width.
Examples
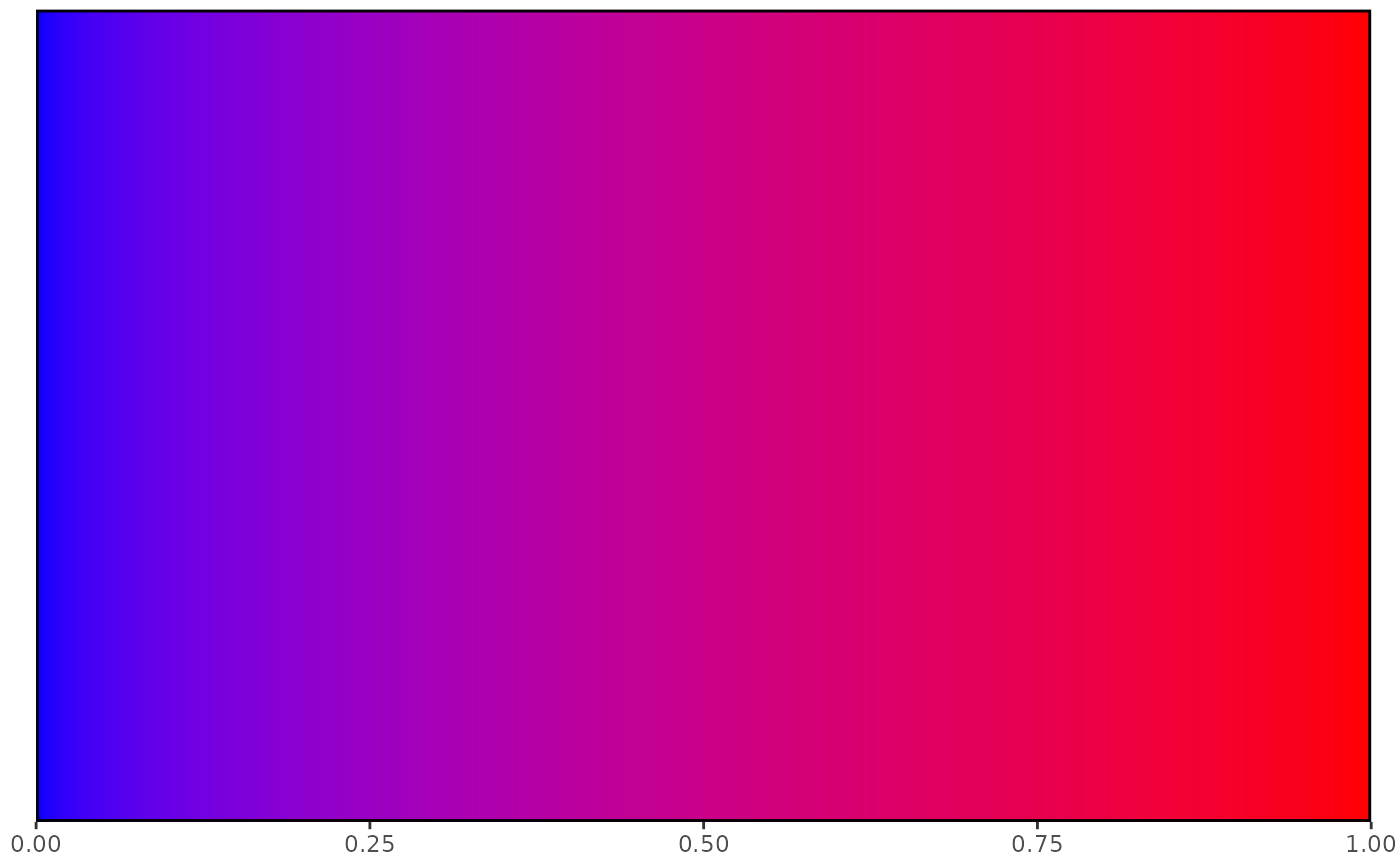
## Defaults match defaults of visualise_methylation()
visualise_methylation_colour_scale()
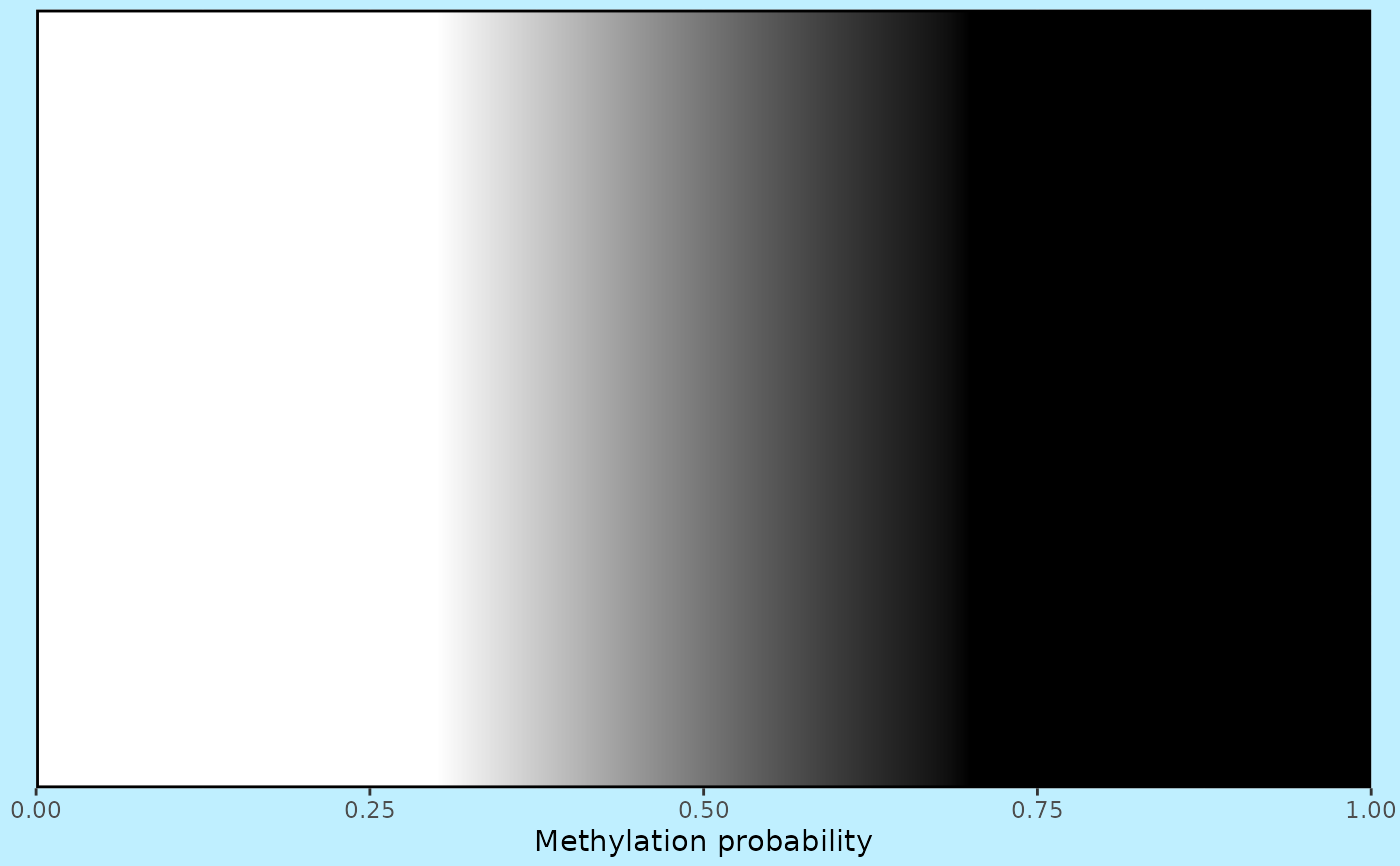
 ## Use clamping and change colours
visualise_methylation_colour_scale(
low_colour = "white",
high_colour = "black",
low_clamp = 0.3*255,
high_clamp = 0.7*255,
full_range = c(0, 255),
background_colour = "lightblue1",
axis_location = "bottom",
axis_title = "Methylation probability"
)
## Use clamping and change colours
visualise_methylation_colour_scale(
low_colour = "white",
high_colour = "black",
low_clamp = 0.3*255,
high_clamp = 0.7*255,
full_range = c(0, 255),
background_colour = "lightblue1",
axis_location = "bottom",
axis_title = "Methylation probability"
)
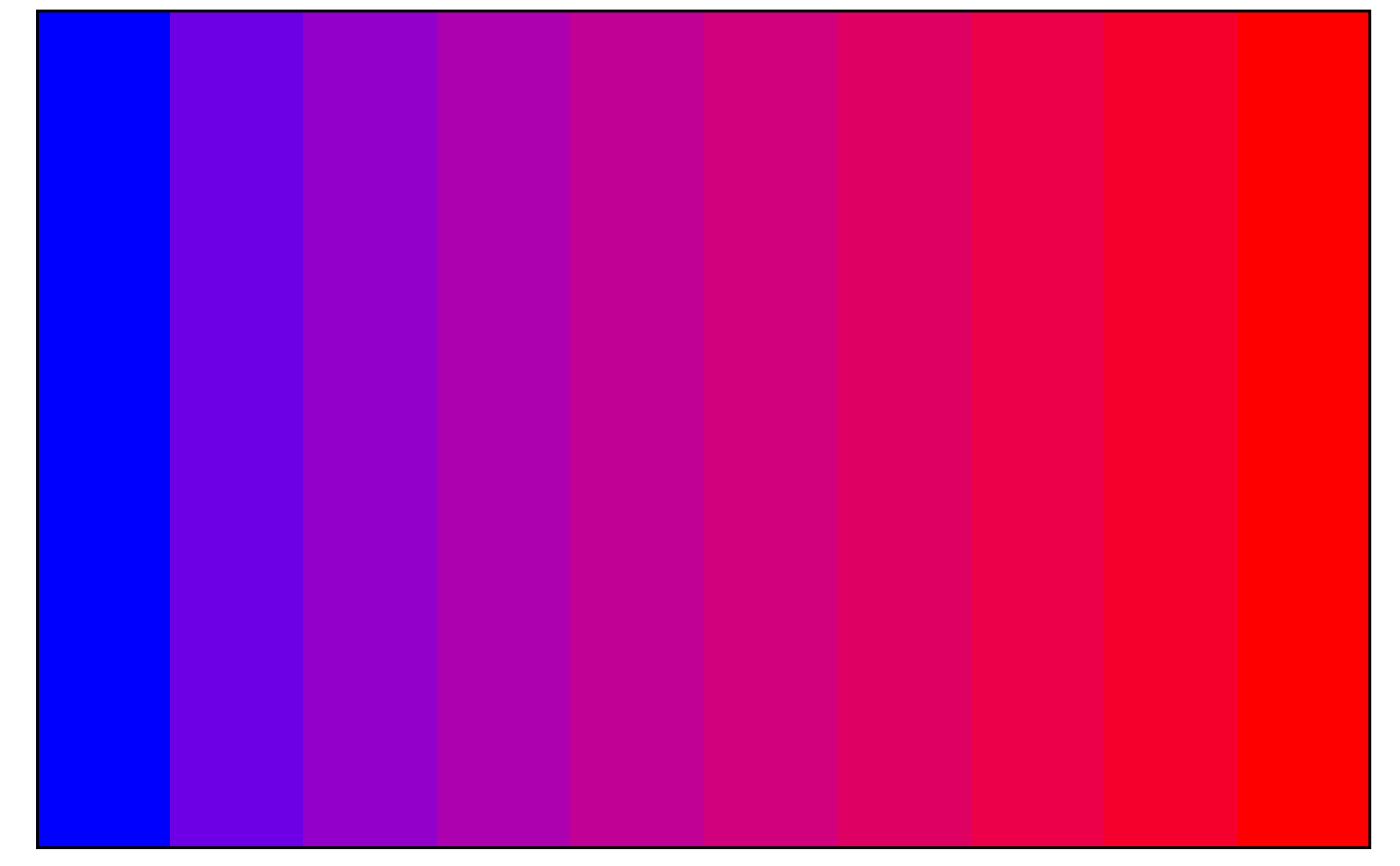
 ## Lower precision = colour banding
visualise_methylation_colour_scale(
precision = 10,
do_axis_ticks = FALSE
)
## Lower precision = colour banding
visualise_methylation_colour_scale(
precision = 10,
do_axis_ticks = FALSE
)
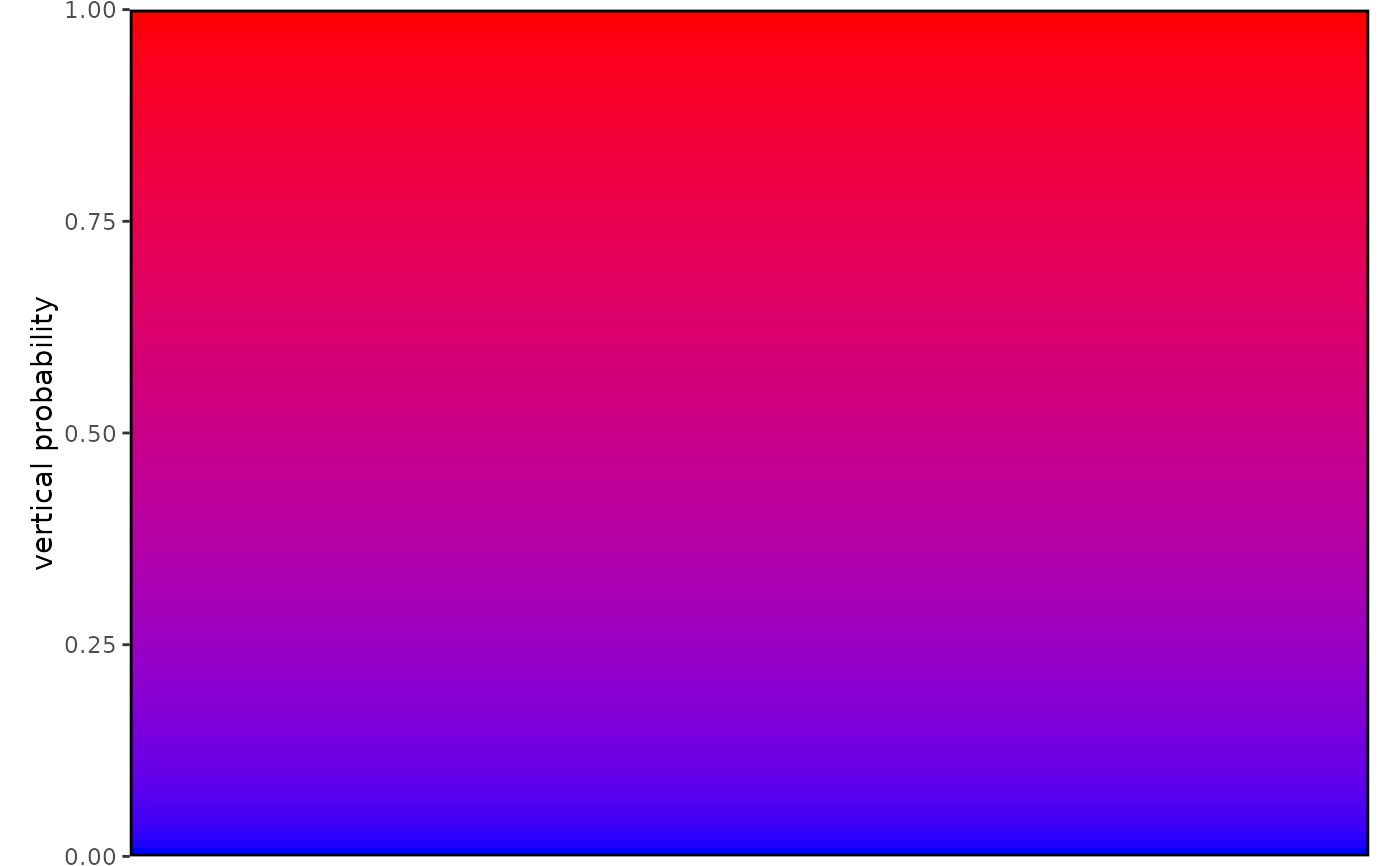
 ## Left axis
visualise_methylation_colour_scale(
precision = 100,
axis_location = "WEST",
axis_title = "vertical probability"
)
## Left axis
visualise_methylation_colour_scale(
precision = 100,
axis_location = "WEST",
axis_title = "vertical probability"
)