Visualise methylation probabilities for many DNA sequences
Source:R/visualise_methylation.R
visualise_methylation.Rdvisualize_methylation() is an alias for visualise_methylation() - see aliases.
This function takes vectors of modifications locations, modification probabilities,
and sequence lengths (e.g. created by extract_and_sort_methylation()) and
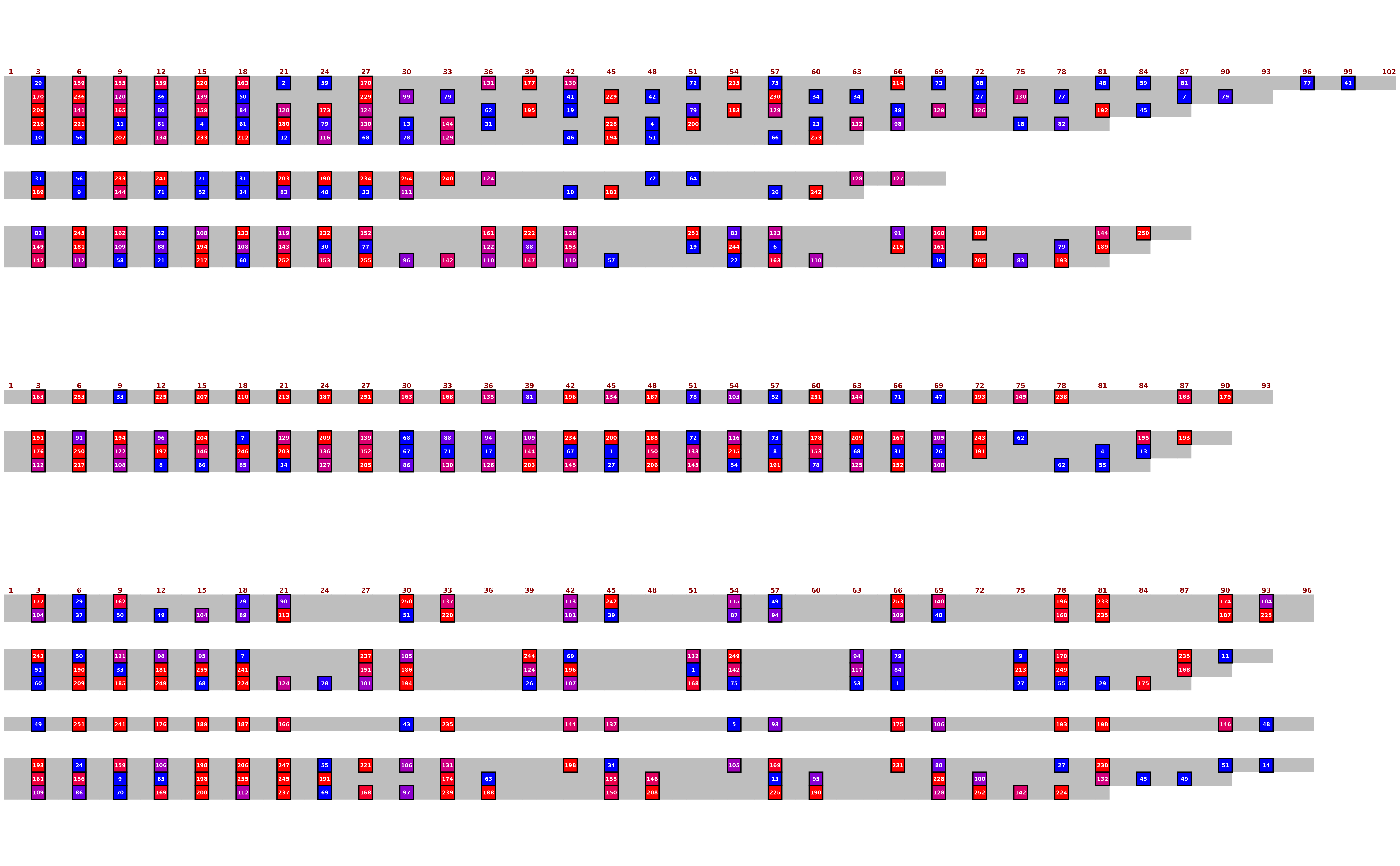
visualises the probability of methylation (or other modification) across each read.
Assumes that the three main input vectors are of equal length \(n\) and represent \(n\) sequences
(e.g. Nanopore reads), where locations are the indices along each read at which modification
was assessed, probabilities are the probability of modification at each assessed site, and
lengths are the lengths of each sequence.
For each sequence, renders non-assessed (e.g. non-CpG) bases as other_bases_colour, renders
background (including after the end of the sequence) as background_colour, and renders assessed
bases on a linear scale from low_colour to high_colour.
Clamping means that the endpoints of the colour gradient can be set some distance into the probability
space e.g. with Nanopore > SAM probability values from 0-255, the default is to render 0 as fully blue
(#0000FF), 255 as fully red (#FF0000), and values in between linearly interpolated. However, clamping with
low_clamp = 100 and high_clamp = 200 would set all probabilities up to 100 as fully blue,
all probabilities 200 and above as fully red, and linearly interpolate only over the 100-200 range.
A separate scalebar plot showing the colours corresponding to each probability, with any/no clamping values,
can be produced via visualise_methylation_colour_scale().
Usage
visualise_methylation(
  modification_locations,
  modification_probabilities,
  sequences,
  ...,
  low_colour = "blue",
  high_colour = "red",
  low_clamp = 0,
  high_clamp = 255,
  background_colour = "white",
  other_bases_colour = "grey",
  sequence_text_type = "none",
  sequence_text_scaling = c(-0.5, 256),
  sequence_text_rounding = 2,
  sequence_text_colour = "black",
  sequence_text_size = 16,
  index_annotation_lines = c(1),
  index_annotation_colour = "darkred",
  index_annotation_size = 12.5,
  index_annotation_interval = 15,
  index_annotations_above = TRUE,
  index_annotation_vertical_position = 1/3,
  index_annotation_full_line = TRUE,
  index_annotation_always_first_base = TRUE,
  index_annotation_always_last_base = TRUE,
  outline_colour = "black",
  outline_linewidth = 3,
  outline_join = "mitre",
  modified_bases_outline_colour = NA,
  modified_bases_outline_linewidth = NA,
  modified_bases_outline_join = NA,
  other_bases_outline_colour = NA,
  other_bases_outline_linewidth = NA,
  other_bases_outline_join = NA,
  margin = 0.5,
  return = TRUE,
  filename = NA,
  force_raster = FALSE,
  render_device = ragg::agg_png,
  pixels_per_base = 100,
  monitor_performance = FALSE
)
Arguments
- modification_locations
character vector. One character value for each sequence, storing a condensed string (e.g."3,6,9,12", produced viavector_to_string()) of the indices along the read at which modification was assessed. Indexing starts at 1.- modification_probabilities
character vector. One character value for each sequence, storing a condensed string (e.g."0,128,255,15", produced viavector_to_string()) of the probability of methylation/modification at each assessed base.
Assumed to be Nanopore > SAM style modification stored as an 8-bit integer from 0 to 255, but changing other arguments could make this work on other scales.- sequences
character vector. One character value for each sequence, storing the actual DNA sequence.- ...
Used to recognise aliases e.g. American spellings or common misspellings - see aliases. If any American spellings do not work, please make a bug report at https://github.com/ejade42/ggDNAvis/issues.
- low_colour
character. The colour that should be used to represent minimum probability of methylation/modification (defaults to blue).- high_colour
character. The colour that should be used to represent maximum probability of methylation/modification (defaults to red).- low_clamp
numeric. The minimum probability below which all values are colouredlow_colour. Defaults to0(i.e. no clamping). To specify a proportion probability in 8-bit form, multiply by 255 e.g. to low-clamp at 30% probability, set this to0.3*255.- high_clamp
numeric. The maximum probability above which all values are colouredhigh_colour. Defaults to255(i.e. no clamping, assuming Nanopore > SAM style modification calling where probabilities are 8-bit integers from 0 to 255).- background_colour
character. The colour the background should be drawn (defaults to white).- other_bases_colour
character. The colour non-assessed (e.g. non-CpG) bases should be drawn (defaults to grey).- sequence_text_type
character. What type of text should be drawn in the boxes. One of"sequence"(to draw the base sequence in the boxes, similar tovisualise_many_sequences()),"probability"(to draw the numerical probability of methylation in each assessed box, optionally scaled viasequence_text_scaling), or"none"(default, to draw the boxes only with no text).- sequence_text_scaling
numeric vector, length 2. The min and max possible probability values, used to facilitate scaling of the text in each to 0-1. Scaling is implemented as \(\frac{p - min}{max}\), so custom scalings (e.g. scaled to 0-9 space) can be implemented by setting this values as required.
Set toc(0, 1)to not scale at all i.e. print the raw integer probability values. It is recommended to also setsequence_text_rounding = 0to print integers as the default value of2will result in e.g."128.00".
Set toc(-0.5, 256)(default, results in \(\frac{p+0.5}{256}\)) to scale to the centre of the probability spaces defined by the SAMtools spec, where integer \(p\) represents the probability space from \(\frac{p}{256}\) to \(\frac{p+1}{256}\). This is slightly better at representing the uncertainty compared toc(0, 255)as strictly speaking0represents the probability space from 0.000 to 0.004 and255represents the probability space from 0.996 to 1.000, so scaling them to 0.002 and 0.998 respectively is a more accurate representation of the probability space they each represent. Settingc(0, 255)would scale such that 0 is exactly 0.000 and 255 is exactly 1.000, which is not as accurate so it discouraged.- sequence_text_rounding
integer. How many decimal places the text drawn in the boxes should be rounded to (defaults to2). Ignored ifsequence_text_typeis"sequence"or"none".- sequence_text_colour
character. The colour of the text within the bases (e.g. colour of "A" letter within boxes representing adenosine bases). Defaults to black.- sequence_text_size
numeric. The size of the text within the bases (e.g. size of "A" letter within boxes representing adenosine bases). Defaults to16. Set to0to hide sequence text (show box colours only).- index_annotation_lines
integer vector. The lines (i.e. elements ofsequences_vector) that should have their base incides annotated. 1-indexed e.g.c(1, 10)would annotate the first and tenth elements ofsequences_vector.
Extra lines are inserted above or below (depending onindex_annotations_above) the selected lines - note that the line numbers come fromsequences_vector, so are unaffected by these insertions.
Setting toNAdisables index annotations (and prevents adding additional blank lines). Defaults toc(1)i.e. first sequence is annotated.
Note:visualise_methylation()andvisualise_many_sequences()acceptNA,NULL,numeric(0),0, andFALSEas meaning "annotations off".- index_annotation_colour
character. The colour of the little numbers underneath indicating base index (e.g. colour of "15" label under the 15th base). Defaults to dark red.- index_annotation_size
numeric. The size of the little number underneath indicating base index (e.g. size of "15" label under the 15th base). Defaults to12.5.
Setting to0disables index annotations (and prevents adding additional blank lines).- index_annotation_interval
integer. The frequency at which numbers should be placed underneath indicating base index, starting counting from the leftmost base. Defaults to15(every 15 bases along each row).
Setting to0disables index annotations (and prevents adding additional blank lines).- index_annotations_above
logical. Whether index annotations should go above (TRUE, default) or below (FALSE) each line of sequence.- index_annotation_vertical_position
numeric. How far annotation numbers should be rendered above (ifindex_annotations_above = TRUE) or below (ifindex_annotations_above = FALSE) each base. Defaults to1/3.
Not recommended to change at all. Strongly discouraged to set below 0 or above 1.- index_annotation_full_line
logical. Whether index annotations should continue to the end of the longest sequence (TRUE, default) or should only continue as far as each selected line does (FALSE).- index_annotation_always_first_base
logical. Whether to force the first base in each line to always be annotated regardless of whether it occurs at theindex_annotation_interval. Defaults toTRUE.- index_annotation_always_last_base
logical. Whether to force the last base in each line to always be annotated regardless of whether it occurs at theindex_annotation_interval. Defaults toTRUE.- outline_colour
character. The colour of the box outlines. Defaults to black.- outline_linewidth
numeric. The linewidth of the box outlines. Defaults to3. Set to0to disable box outlines.- outline_join
character. One of"mitre","round", or"bevel"specifying how outlines should be joined at the corners of boxes. Defaults to"mitre". It would be unusual to need to change this.- modified_bases_outline_colour
character. IfNA(default), inherits fromoutline_colour. If notNA, overridesoutline_colourfor modification-assessed bases only.- modified_bases_outline_linewidth
numeric. IfNA(default), inherits fromoutline_linewidth. If notNA, overridesoutline_linewidthfor modification-assessed bases only.- modified_bases_outline_join
character. IfNA(default), inherits fromoutline_join. If notNA, overridesoutline_joinfor modification-assessed bases only.- other_bases_outline_colour
character. IfNA(default), inherits fromoutline_colour. If notNA, overridesoutline_colourfor non-modification-assessed bases only.- other_bases_outline_linewidth
numeric. IfNA(default), inherits fromoutline_linewidth. If notNA, overridesoutline_linewidthfor non-modification-assessed bases only.- other_bases_outline_join
character. IfNA(default), inherits fromoutline_join. If notNA, overridesoutline_joinfor non-modification-assessed bases only.- margin
numeric. The size of the margin relative to the size of each base square. Defaults to0.5(half the side length of each base square).
Note that index annotations can require a minimum margin size at the top or bottom if present above the first/below the last row. This is handled automatically but can mean the top/bottom margin is sometimes larger than themarginsetting.
Very small margins (\(\le\)0.25) may cause thick outlines to be cut off at the edges of the plot. Recommended to either use a wider margin or a smalleroutline_linewidth.- return
logical. Boolean specifying whether this function should return the ggplot object, otherwise it will returninvisible(NULL). Defaults toTRUE.- filename
character. Filename to which output should be saved. If set toNA(default), no file will be saved. Recommended to end with".png", but can change if render device is changed.- force_raster
logical. Boolean specifying whetherggplot2::geom_raster()should be used even if it will remove text and outlines. Defaults toFALSE.
To make the detailed plots with box outlines, sequence text, and index annotations,ggplot2::geom_tile()is used. However,geom_tileis slower for huge datasets, so there is an option to usegeom_rasterinstead.geom_rasterdoes not support box outlines, sequence text, or index annotations, but is much faster if only the colours are wanted.geom_rasteris automatically used if it will not change the plot (i.e. if all extraneous elements are already off), but can be forced using this argument.- render_device
function/character. Device to use when rendering. Seeggplot2::ggsave()documentation for options. Defaults toragg::agg_png. Can be set toNULLto infer from file extension, but results may vary between systems.- pixels_per_base
integer. How large each box should be in pixels, if file output is turned on via settingfilename. Corresponds to dpi of the exported image. Defaults to100.
Large values (e.g. 100) are required to render small text properly. Small values (e.g. 20) will work when sequence/annotation text is off, and very small values (e.g. 10) will work when sequence/annotation text and outlines are all off.- monitor_performance
logical. Boolean specifying whether verbose performance monitoring should be messaged to console. Defaults toFALSE.
Value
A ggplot object containing the full visualisation, or invisible(NULL) if return = FALSE. It is often more useful to use filename = "myfilename.png", because then the visualisation is exported at the correct aspect ratio.
Examples
# \donttest{
## Extract info from dataframe
methylation_info <- extract_and_sort_methylation(example_many_sequences)
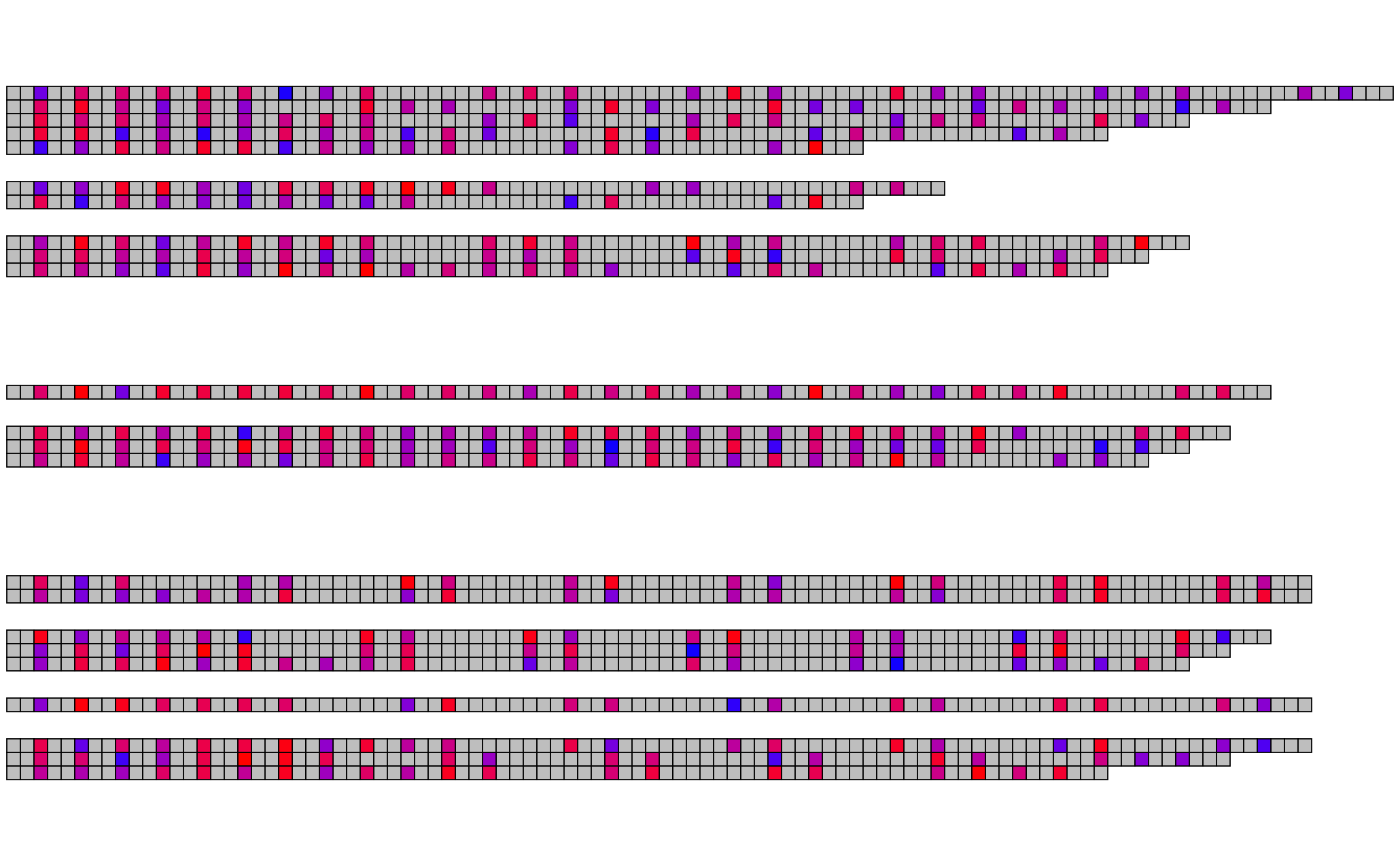
## Visualise example_many_sequences with all defaults
## This looks ugly because it isn't at the right scale/aspect ratio
visualise_methylation(
methylation_info$locations,
methylation_info$probabilities,
methylation_info$sequences
)
 ## Export with all defaults rather than returning
visualise_methylation(
methylation_info$locations,
methylation_info$probabilities,
methylation_info$sequences,
filename = "example_vm_01.png",
return = FALSE
)
## View exported image
image <- png::readPNG("example_vm_01.png")
unlink("example_vm_01.png")
grid::grid.newpage()
grid::grid.raster(image)
## Export with all defaults rather than returning
visualise_methylation(
methylation_info$locations,
methylation_info$probabilities,
methylation_info$sequences,
filename = "example_vm_01.png",
return = FALSE
)
## View exported image
image <- png::readPNG("example_vm_01.png")
unlink("example_vm_01.png")
grid::grid.newpage()
grid::grid.raster(image)
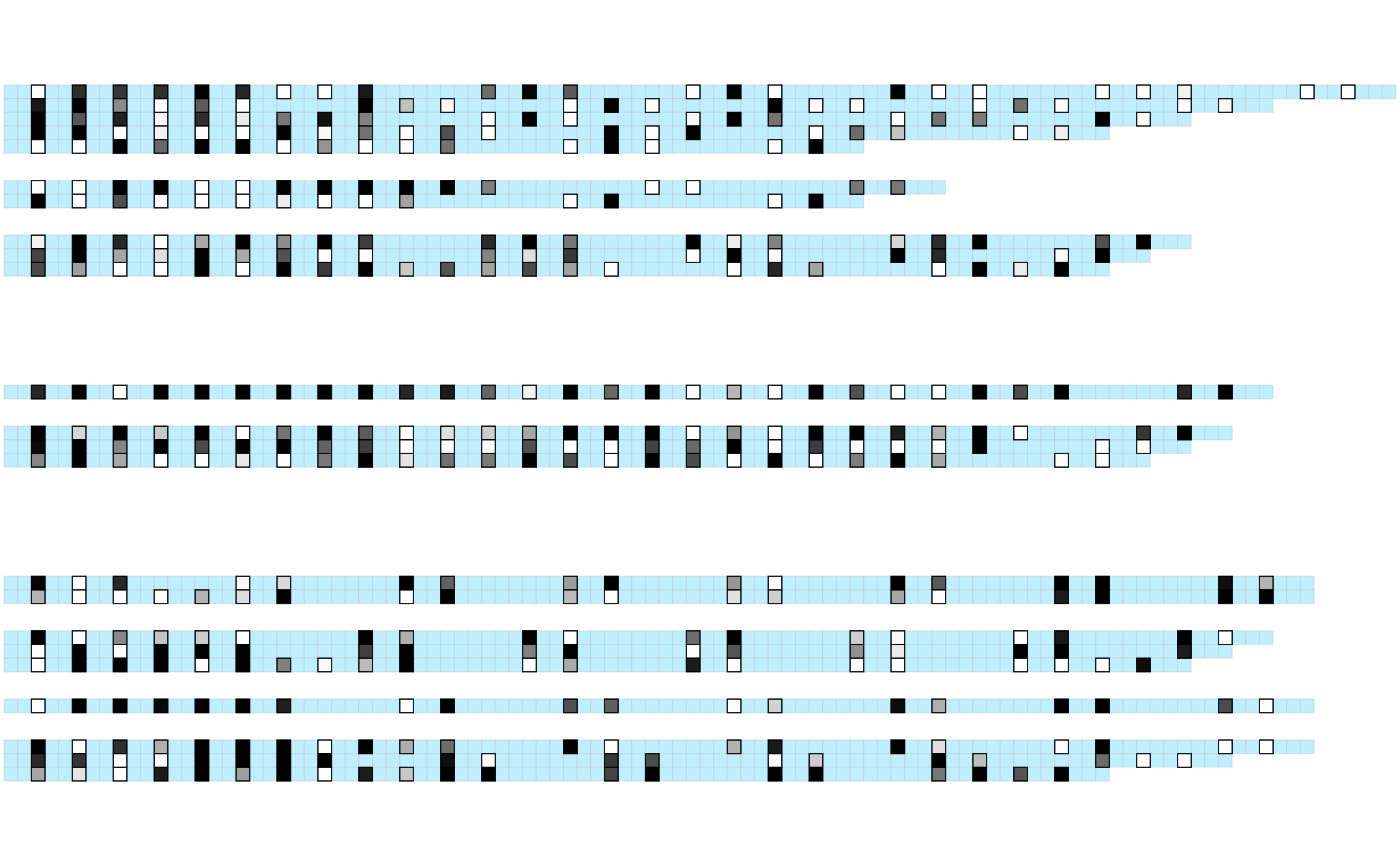
 ## Export with customisation
visualise_methylation(
methylation_info$locations,
methylation_info$probabilities,
methylation_info$sequences,
filename = "example_vm_02.png",
return = FALSE,
low_colour = "white",
high_colour = "black",
low_clamp = 0.3*255,
high_clamp = 0.7*255,
index_annotation_lines = c(1, 23, 37),
index_annotation_interval = 3,
index_annotation_full_line = FALSE,
index_annotation_always_first_base = TRUE,
index_annotation_always_last_base = TRUE,
other_bases_colour = "lightblue1",
other_bases_outline_linewidth = 1,
other_bases_outline_colour = "grey",
modified_bases_outline_linewidth = 3,
modified_bases_outline_colour = "black",
margin = 0.3
)
## View exported image
image <- png::readPNG("example_vm_02.png")
unlink("example_vm_02.png")
grid::grid.newpage()
grid::grid.raster(image)
## Export with customisation
visualise_methylation(
methylation_info$locations,
methylation_info$probabilities,
methylation_info$sequences,
filename = "example_vm_02.png",
return = FALSE,
low_colour = "white",
high_colour = "black",
low_clamp = 0.3*255,
high_clamp = 0.7*255,
index_annotation_lines = c(1, 23, 37),
index_annotation_interval = 3,
index_annotation_full_line = FALSE,
index_annotation_always_first_base = TRUE,
index_annotation_always_last_base = TRUE,
other_bases_colour = "lightblue1",
other_bases_outline_linewidth = 1,
other_bases_outline_colour = "grey",
modified_bases_outline_linewidth = 3,
modified_bases_outline_colour = "black",
margin = 0.3
)
## View exported image
image <- png::readPNG("example_vm_02.png")
unlink("example_vm_02.png")
grid::grid.newpage()
grid::grid.raster(image)
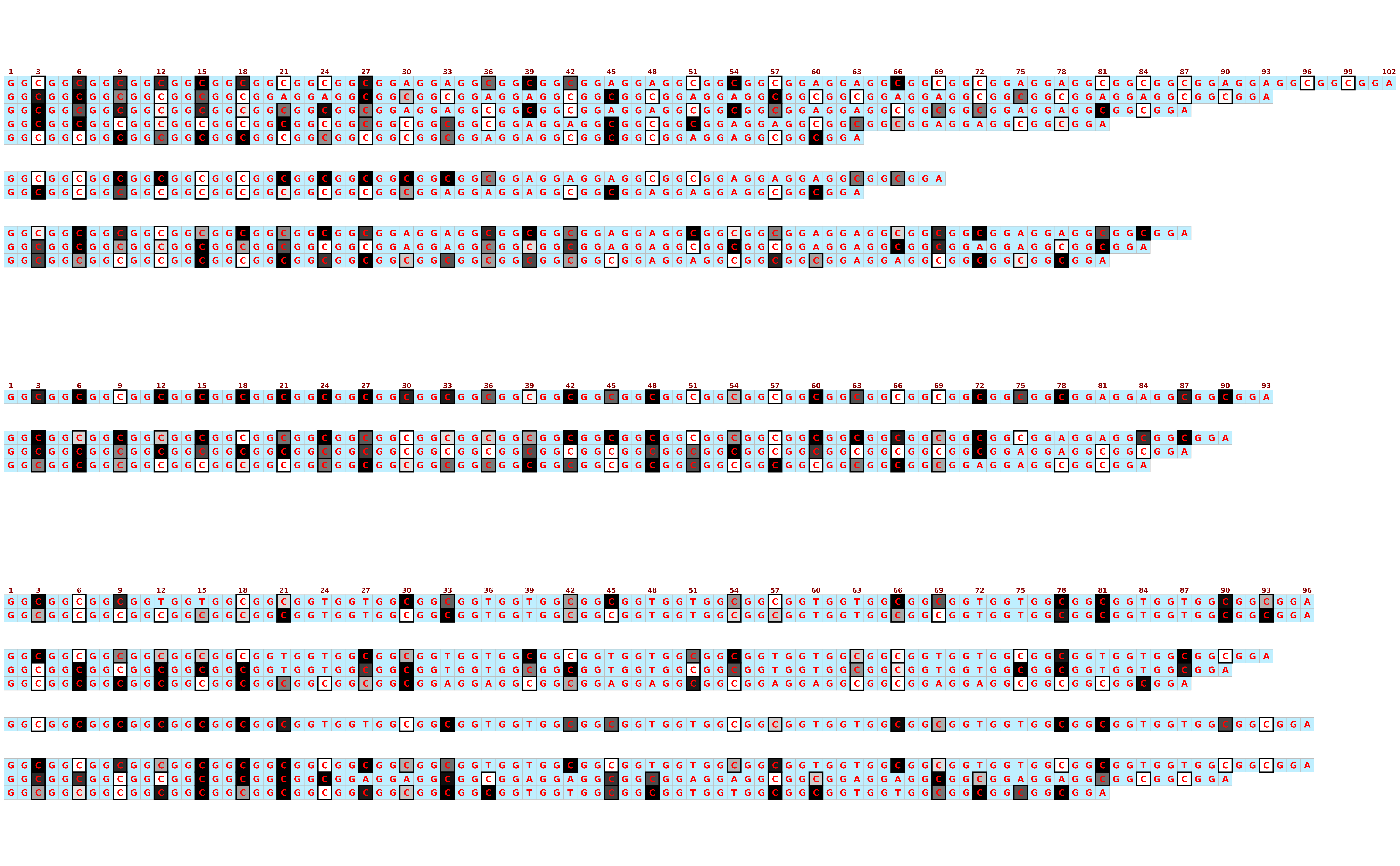
 ## Export with customisation, viewing sequences
visualise_methylation(
methylation_info$locations,
methylation_info$probabilities,
methylation_info$sequences,
filename = "example_vm_03.png",
return = FALSE,
low_colour = "white",
high_colour = "black",
low_clamp = 0.3*255,
high_clamp = 0.7*255,
sequence_text_type = "sequence",
sequence_text_colour = "red",
index_annotation_lines = c(1, 23, 37),
index_annotation_interval = 3,
index_annotation_full_line = FALSE,
index_annotation_always_first_base = TRUE,
index_annotation_always_last_base = TRUE,
other_bases_colour = "lightblue1",
other_bases_outline_linewidth = 1,
other_bases_outline_colour = "grey",
modified_bases_outline_linewidth = 3,
modified_bases_outline_colour = "black",
margin = 0.3
)
## View exported image
image <- png::readPNG("example_vm_03.png")
unlink("example_vm_03.png")
grid::grid.newpage()
grid::grid.raster(image)
## Export with customisation, viewing sequences
visualise_methylation(
methylation_info$locations,
methylation_info$probabilities,
methylation_info$sequences,
filename = "example_vm_03.png",
return = FALSE,
low_colour = "white",
high_colour = "black",
low_clamp = 0.3*255,
high_clamp = 0.7*255,
sequence_text_type = "sequence",
sequence_text_colour = "red",
index_annotation_lines = c(1, 23, 37),
index_annotation_interval = 3,
index_annotation_full_line = FALSE,
index_annotation_always_first_base = TRUE,
index_annotation_always_last_base = TRUE,
other_bases_colour = "lightblue1",
other_bases_outline_linewidth = 1,
other_bases_outline_colour = "grey",
modified_bases_outline_linewidth = 3,
modified_bases_outline_colour = "black",
margin = 0.3
)
## View exported image
image <- png::readPNG("example_vm_03.png")
unlink("example_vm_03.png")
grid::grid.newpage()
grid::grid.raster(image)
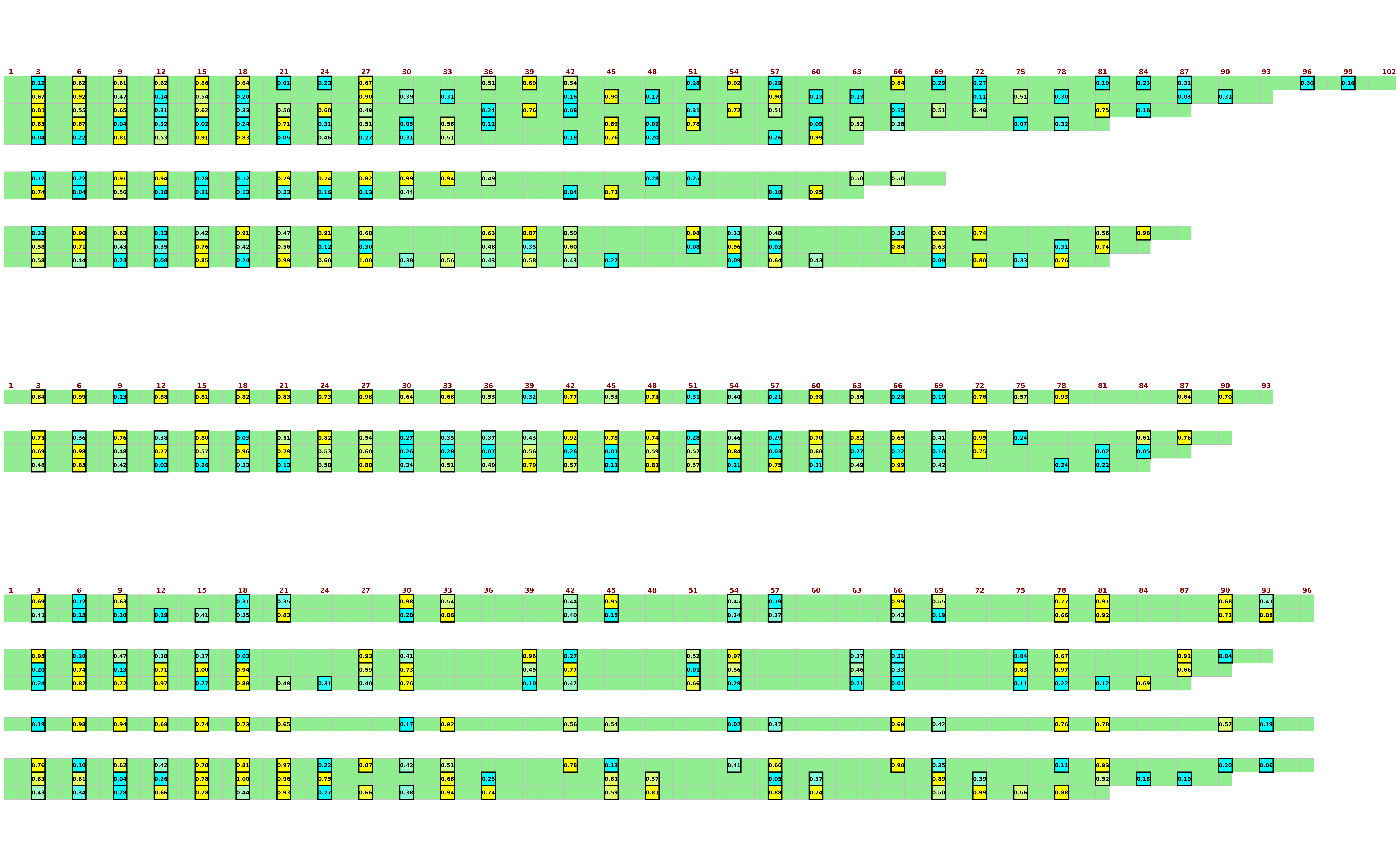
 ## Export with customisation, viewing probabilities
visualise_methylation(
methylation_info$locations,
methylation_info$probabilities,
methylation_info$sequences,
filename = "example_vm_04.png",
return = FALSE,
low_colour = "cyan",
high_colour = "yellow",
low_clamp = 0.3*255,
high_clamp = 0.7*255,
sequence_text_type = "probability",
sequence_text_size = 10,
sequence_text_colour = "black",
index_annotation_lines = c(1, 23, 37),
index_annotation_interval = 3,
index_annotation_full_line = FALSE,
index_annotation_always_first_base = TRUE,
index_annotation_always_last_base = TRUE,
other_bases_colour = "lightgreen",
other_bases_outline_linewidth = 1,
other_bases_outline_colour = "grey",
modified_bases_outline_linewidth = 3,
modified_bases_outline_colour = "black",
margin = 0.3
)
## View exported image
image <- png::readPNG("example_vm_04.png")
unlink("example_vm_04.png")
grid::grid.newpage()
grid::grid.raster(image)
## Export with customisation, viewing probabilities
visualise_methylation(
methylation_info$locations,
methylation_info$probabilities,
methylation_info$sequences,
filename = "example_vm_04.png",
return = FALSE,
low_colour = "cyan",
high_colour = "yellow",
low_clamp = 0.3*255,
high_clamp = 0.7*255,
sequence_text_type = "probability",
sequence_text_size = 10,
sequence_text_colour = "black",
index_annotation_lines = c(1, 23, 37),
index_annotation_interval = 3,
index_annotation_full_line = FALSE,
index_annotation_always_first_base = TRUE,
index_annotation_always_last_base = TRUE,
other_bases_colour = "lightgreen",
other_bases_outline_linewidth = 1,
other_bases_outline_colour = "grey",
modified_bases_outline_linewidth = 3,
modified_bases_outline_colour = "black",
margin = 0.3
)
## View exported image
image <- png::readPNG("example_vm_04.png")
unlink("example_vm_04.png")
grid::grid.newpage()
grid::grid.raster(image)
 ## Export with customisation, viewing probability integers
visualise_methylation(
methylation_info$locations,
methylation_info$probabilities,
methylation_info$sequences,
filename = "example_vm_05.png",
return = FALSE,
low_colour = "blue",
high_colour = "red",
low_clamp = 0.3*255,
high_clamp = 0.7*255,
sequence_text_type = "probability",
sequence_text_scaling = c(0, 1),
sequence_text_rounding = 0,
sequence_text_size = 10,
sequence_text_colour = "white",
index_annotation_lines = c(1, 23, 37),
index_annotation_interval = 3,
index_annotation_full_line = FALSE,
index_annotation_always_first_base = TRUE,
index_annotation_always_last_base = TRUE,
other_bases_outline_linewidth = 1,
other_bases_outline_colour = "grey",
modified_bases_outline_linewidth = 3,
modified_bases_outline_colour = "black",
margin = 0.3
)
## View exported image
image <- png::readPNG("example_vm_05.png")
unlink("example_vm_05.png")
grid::grid.newpage()
grid::grid.raster(image)
## Export with customisation, viewing probability integers
visualise_methylation(
methylation_info$locations,
methylation_info$probabilities,
methylation_info$sequences,
filename = "example_vm_05.png",
return = FALSE,
low_colour = "blue",
high_colour = "red",
low_clamp = 0.3*255,
high_clamp = 0.7*255,
sequence_text_type = "probability",
sequence_text_scaling = c(0, 1),
sequence_text_rounding = 0,
sequence_text_size = 10,
sequence_text_colour = "white",
index_annotation_lines = c(1, 23, 37),
index_annotation_interval = 3,
index_annotation_full_line = FALSE,
index_annotation_always_first_base = TRUE,
index_annotation_always_last_base = TRUE,
other_bases_outline_linewidth = 1,
other_bases_outline_colour = "grey",
modified_bases_outline_linewidth = 3,
modified_bases_outline_colour = "black",
margin = 0.3
)
## View exported image
image <- png::readPNG("example_vm_05.png")
unlink("example_vm_05.png")
grid::grid.newpage()
grid::grid.raster(image)
 # }
# }